 GRAPHS OF LOGARITHMIC FUNCTIONS
  GRAPHS OF LOGARITHMIC FUNCTIONS
In this section we will illustrate, interpret, and discuss the graphs of logarithmic functions. We will also illustrate how you can use graphs to HELP you solve logarithmic problems.
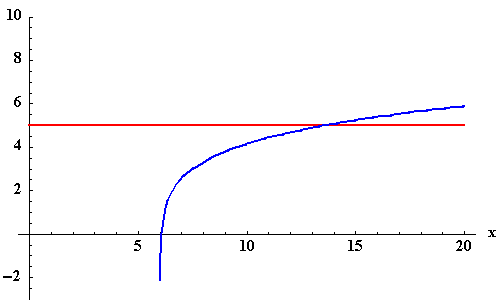
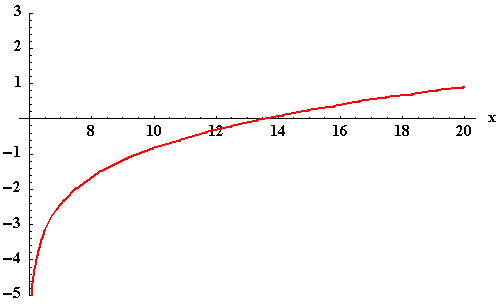
Solving an equation from a graph. When we solve an equation algebraically, we set the equation equal to zero and find those values that cause the equation to equal zero. When we solve an equation graphically, we look for points of intersection, or re-arrange the equation and look for the x-intercepts (best method).
If there is one equation, we look to see where the graph crosses the x-axis. The x-intercepts are the solutions to the equation. The x-intercepts are those values of x that cause the function value to be zero.
If you are solving two equations graphically, you have two options. You can graph both equations and determine the value of x at the point(s) of intersection. You can also create a new graph by subtracting one function from another, graph the new function, and find the x-intercepts.
In the following examples, we will solve the equations algebraically and graphically.
Example 19: Solve the equation ![]() for x algebraically and graphically.
for x algebraically and graphically.
Algebraically:
Graphically - Method 1:

|
Graphically - Method 2:

|


 S.O.S MATHematics home page
 Do you need more help? Please post your question on our S.O.S. Mathematics CyberBoard.

Author: Nancy Marcus